Purpose: This page provides guidance for entering results from the Minnesota Feedlot Annualized Runoff Model (MinnFARM) pollution reduction estimates in eLINK. This document will address only how to in the Indicators Tab within the Land and Water Projects Module of eLINK4Web reporting program.
Background
Feedlot projects will use MinnFARM to estimate reductions in annual pollutant loading. The most current version of the model (Excel spreadsheet), the MinnFARM user guide, and a MinnFARM Overview (narrated PowerPoint) are provided at the following website: www.manure.umn.edu/applied/open_lots.html. Program policies and reporting requirements may vary by grant period, please see the BWSR website for additional information.
Getting Started
Before entering information into eLINK, the user must first run the MinnFARM feedlot evaluation model twice to represent the project before and after the installation. The difference between those two scenarios is reported as the pollution reduction. For example:
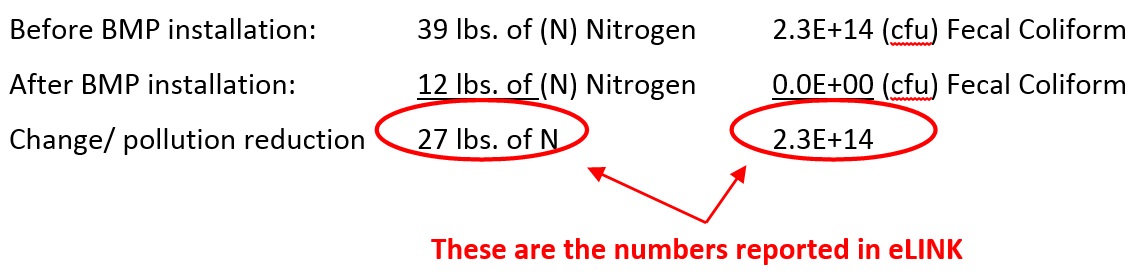
Figure 1: MinnFARM Model Outputs Before BMP Installation
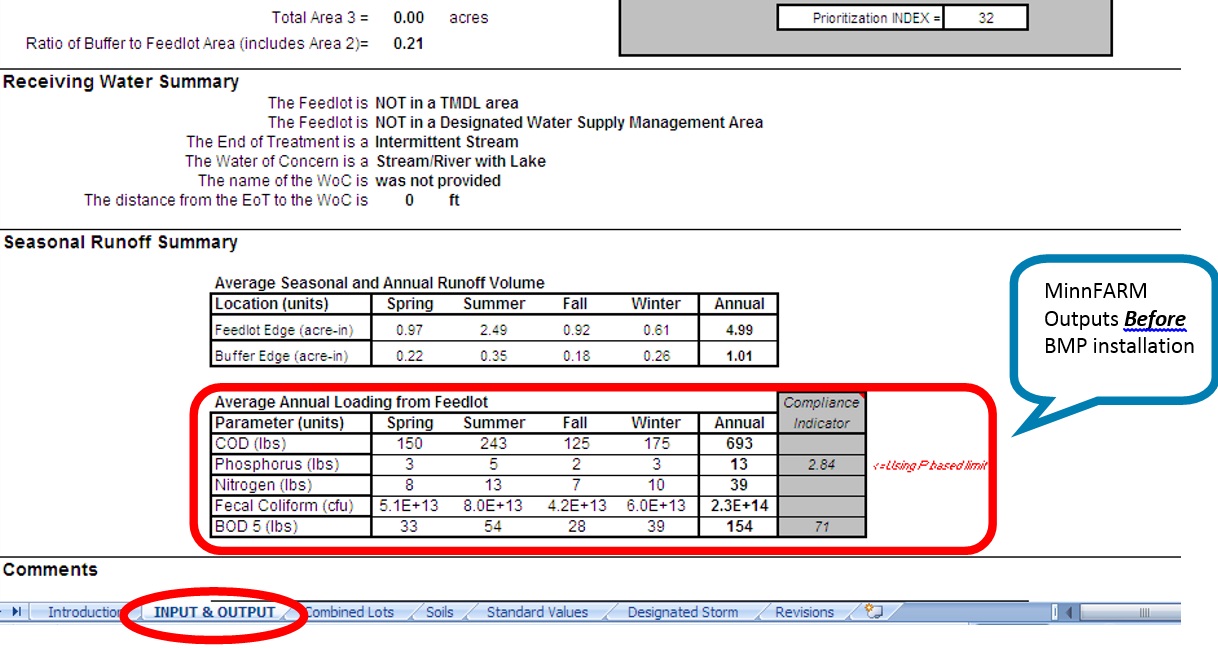
Figure 2: MinnFARM Model Outputs After BMP Installation
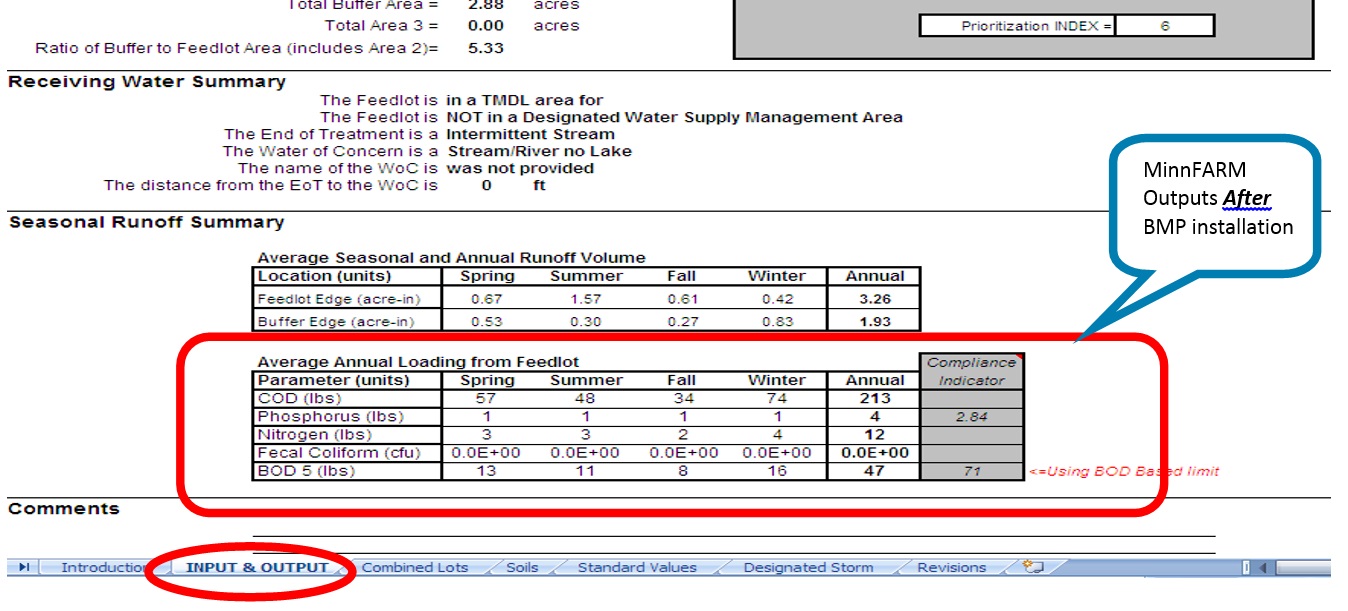
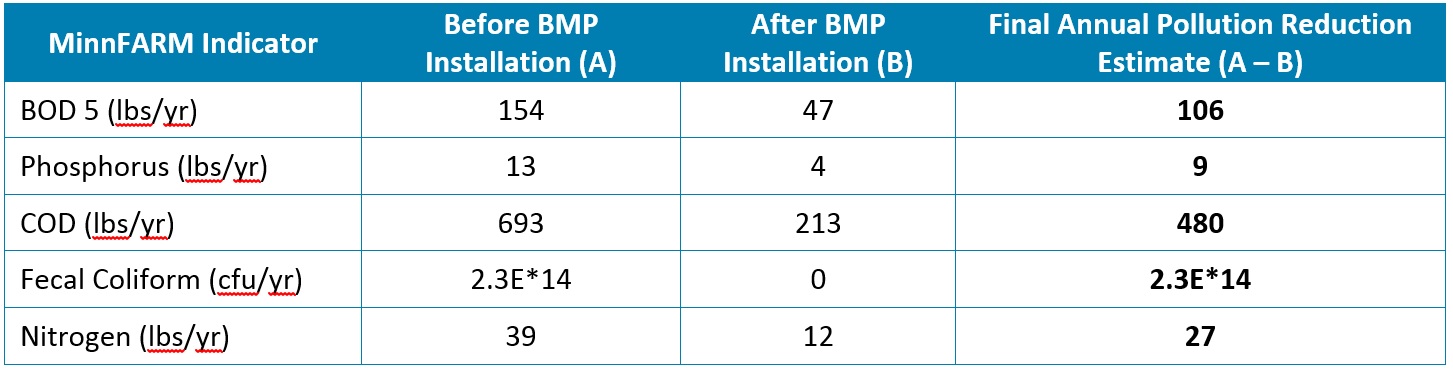
Figure 3: Example MinnFARM Pollution Reduction Calculation Derived from Figures 1-2 and 1-3 Data
How to Enter Pollution Reduction Estimates
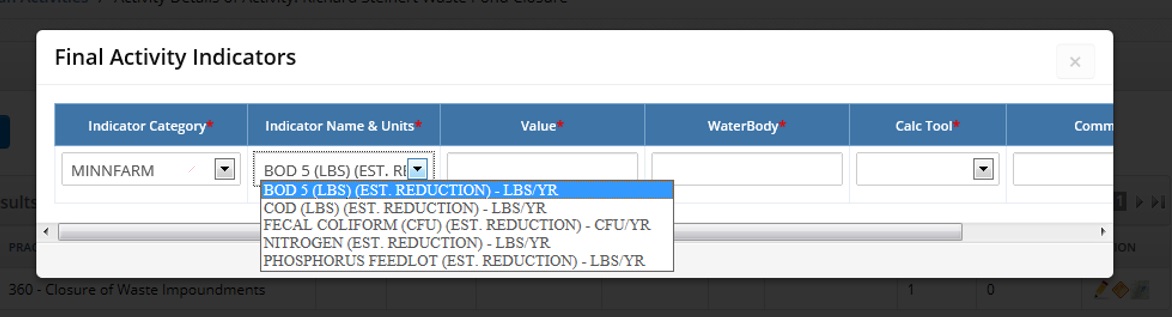
Use the eLINK Guidance Document Managing Activities to navigate to the Activity Details page for your feedlot project. Click Add to complete indicator information, also known as benefit calculation or pollution reduction.
All five of the indicators reported by MinnFARM must be entered: phosphorus, nitrogen, chemical oxygen demand (COD), fecal coliform, and five-day biological oxygen demand (BOD 5).
- Click the indicators icon to add final annual pollution reduction estimates for your feedlot project.
- Indicator Category: select MinnFARM from the dropdown list. This will filter the available indicators in the next column.
- Indicator Name & Units: select the specific MinnFARM indicator name, e.g. BOD5.
- Value: enter the value consistent with estimate for this indicator.
- Waterbody: enter the waterbody the indicator is intending to address
- Calc. Tool: select MinnFARM again.
- Comments: enter additional information about the calculation or describe any assumptions used in calculating the indicator information that may be helpful in future analysis, if applicable.
- Scroll all the way to the right and click the save icon to save your work and enter the next indicator. Repeat for each of the indicators reported by MinnFARM (Phosphorus, Nitrogen, COD, Fecal Coliform, BOD 5).